Rental Housing Market and Directed Search
Introduction
Context
Housing costs have outpaced household disposable income worldwide
% change in selected household items and median income, OECD average, 1995-2018:
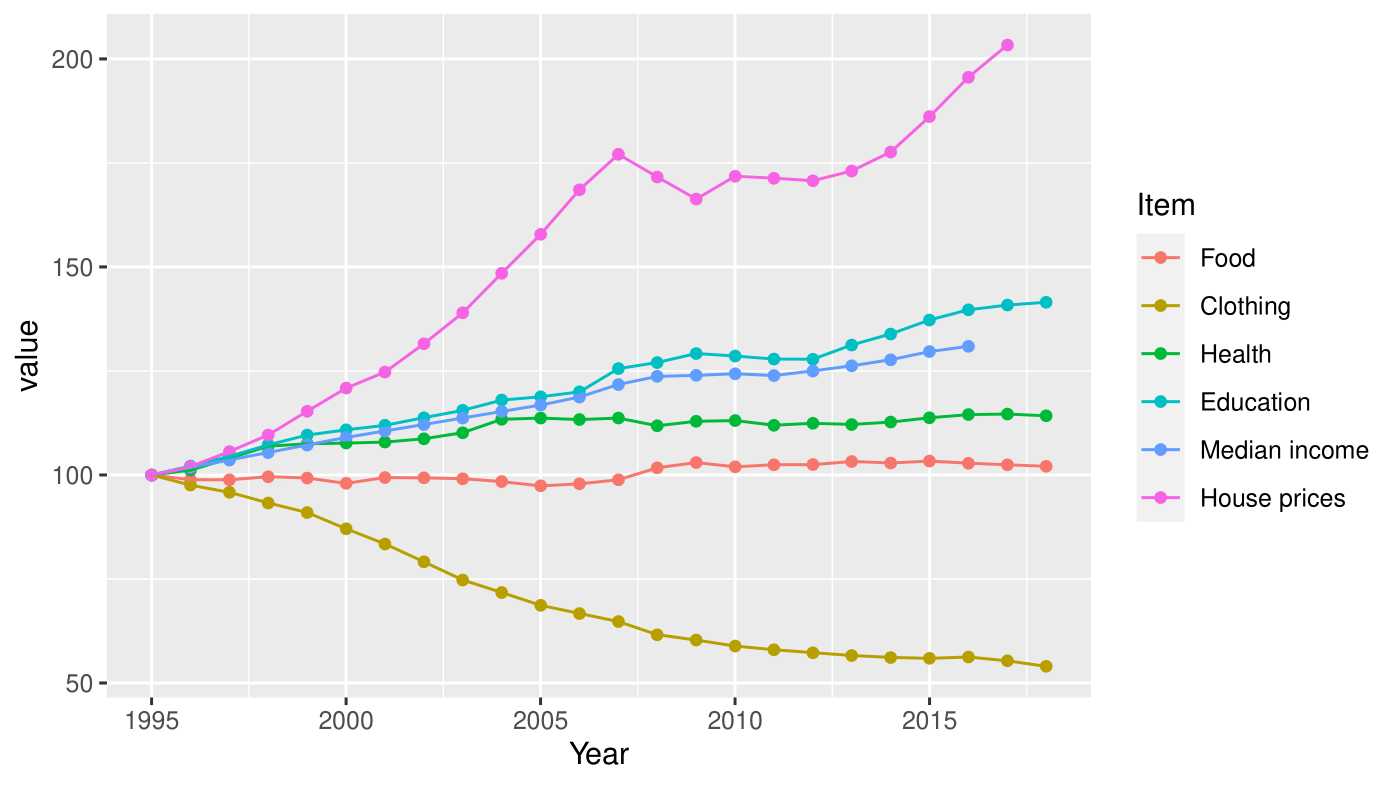 Source: OECD
Why this paper?
Rental property market is understudied
- Lack of data?
New stylized facts for the rental property market
Random versus directed search:
Implications for policy designs
Contributions
- Build and utilize a novel dataset showing evidence of directed search on the rental property market
- New evidence of rent setting dynamics (“slow Dutch auction”)
- Show how to integrate photos in a hedonic pricing model using a Convolutional Neural Network (CNN)
Data
Data Sources
- Web scraping: online platform that collects online ads for the Paris market between April and May 2019
- I have data on the two sides of the rental housing market:
- supply: apartment features, text description and photos
- demand: number of contacts received by landlords (through the online platform)
Descriptive statistics
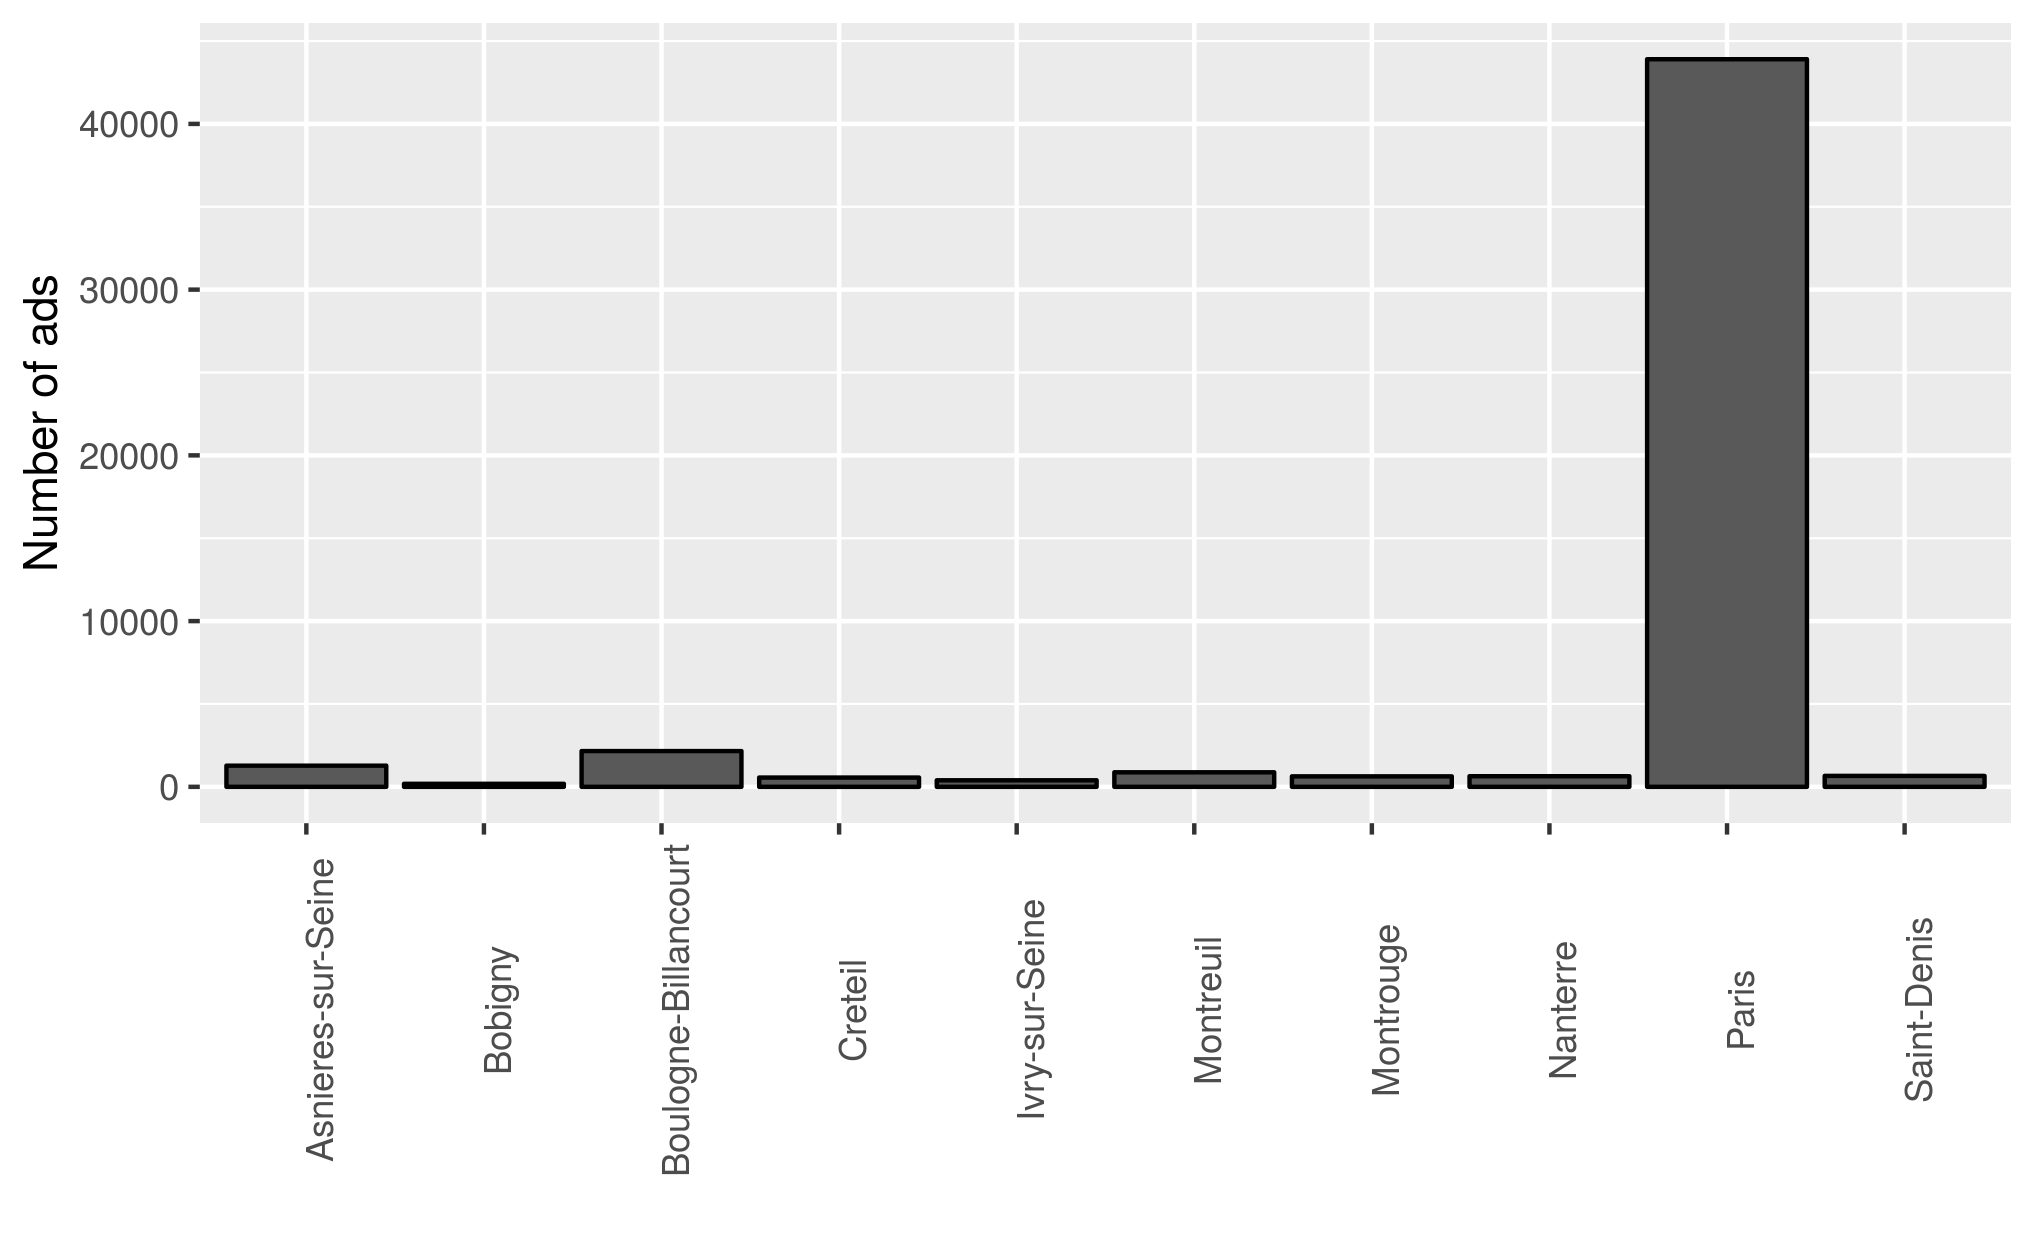
Ads per city
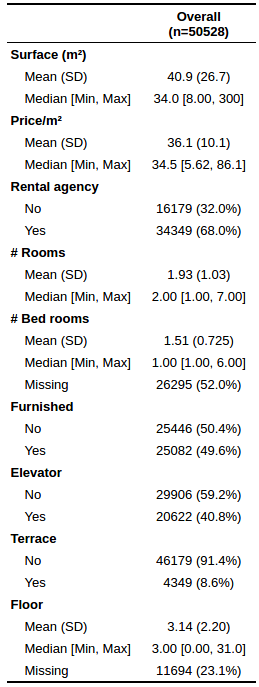
Apartment features
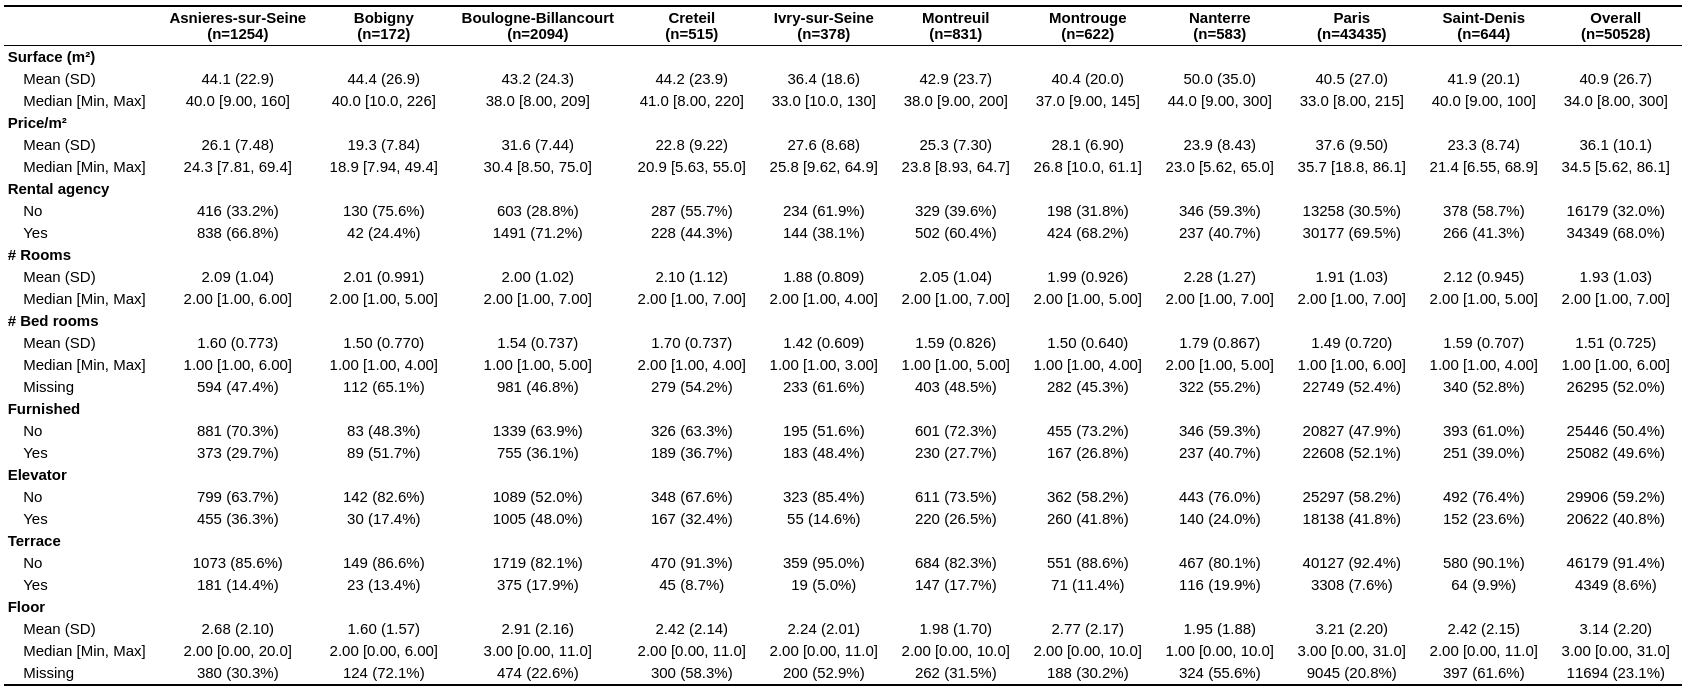
Apartment features by city
Population (2017)
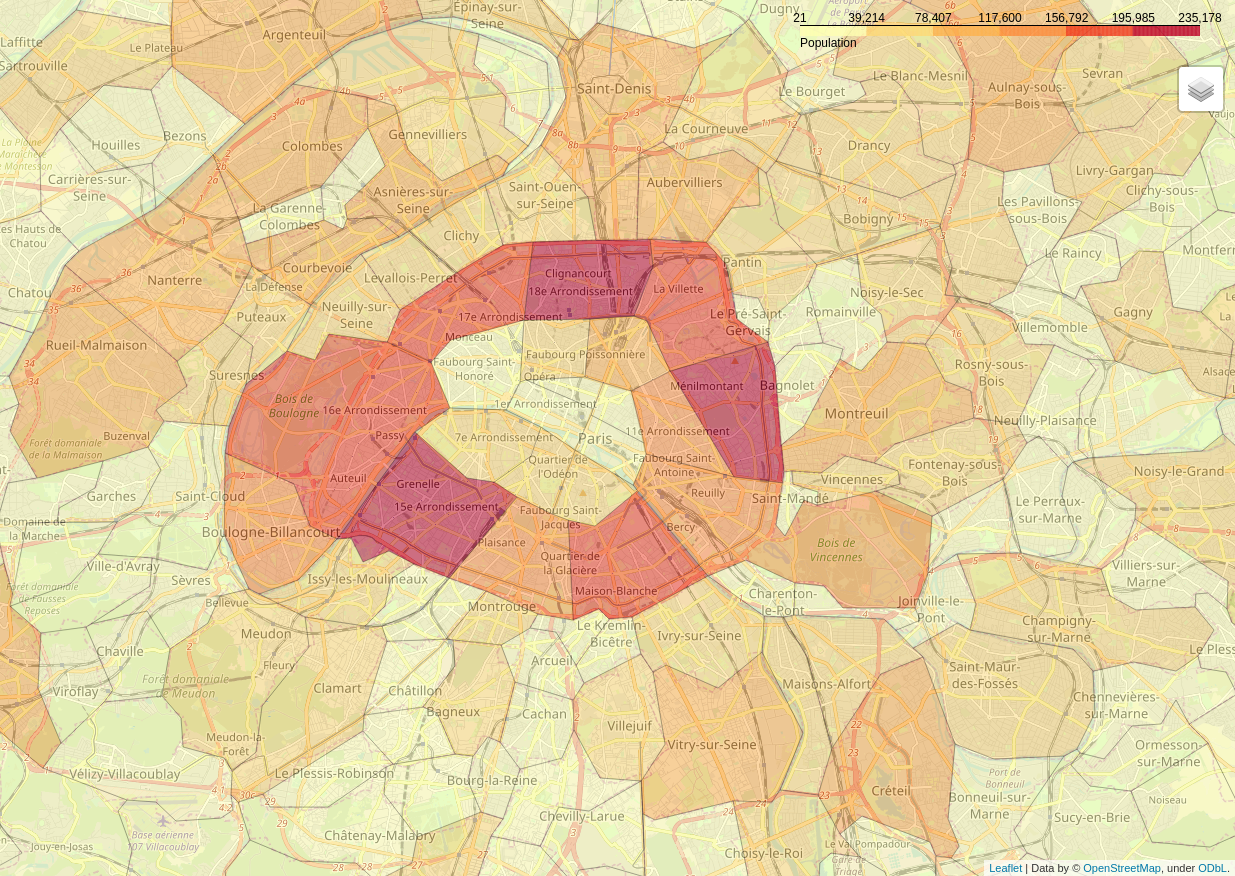
Number of ads
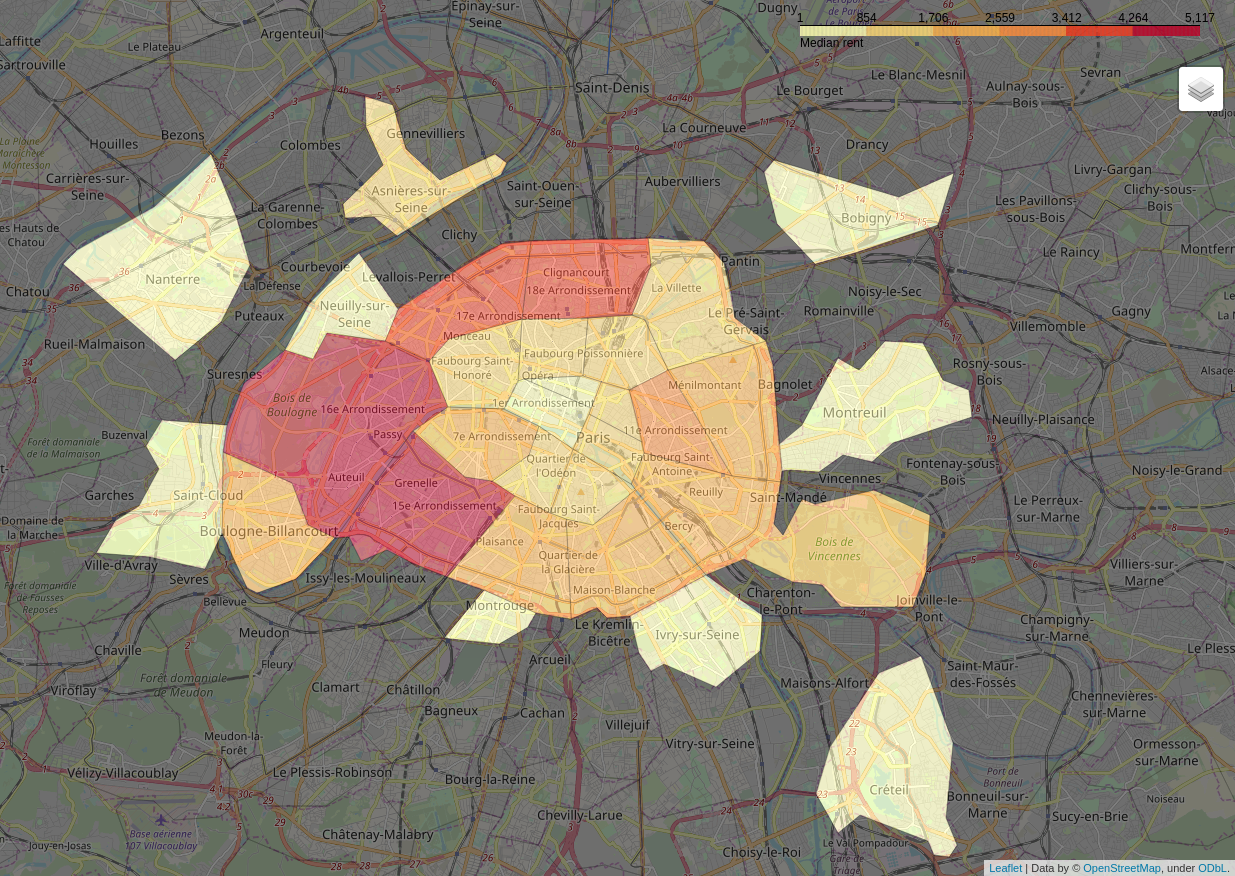
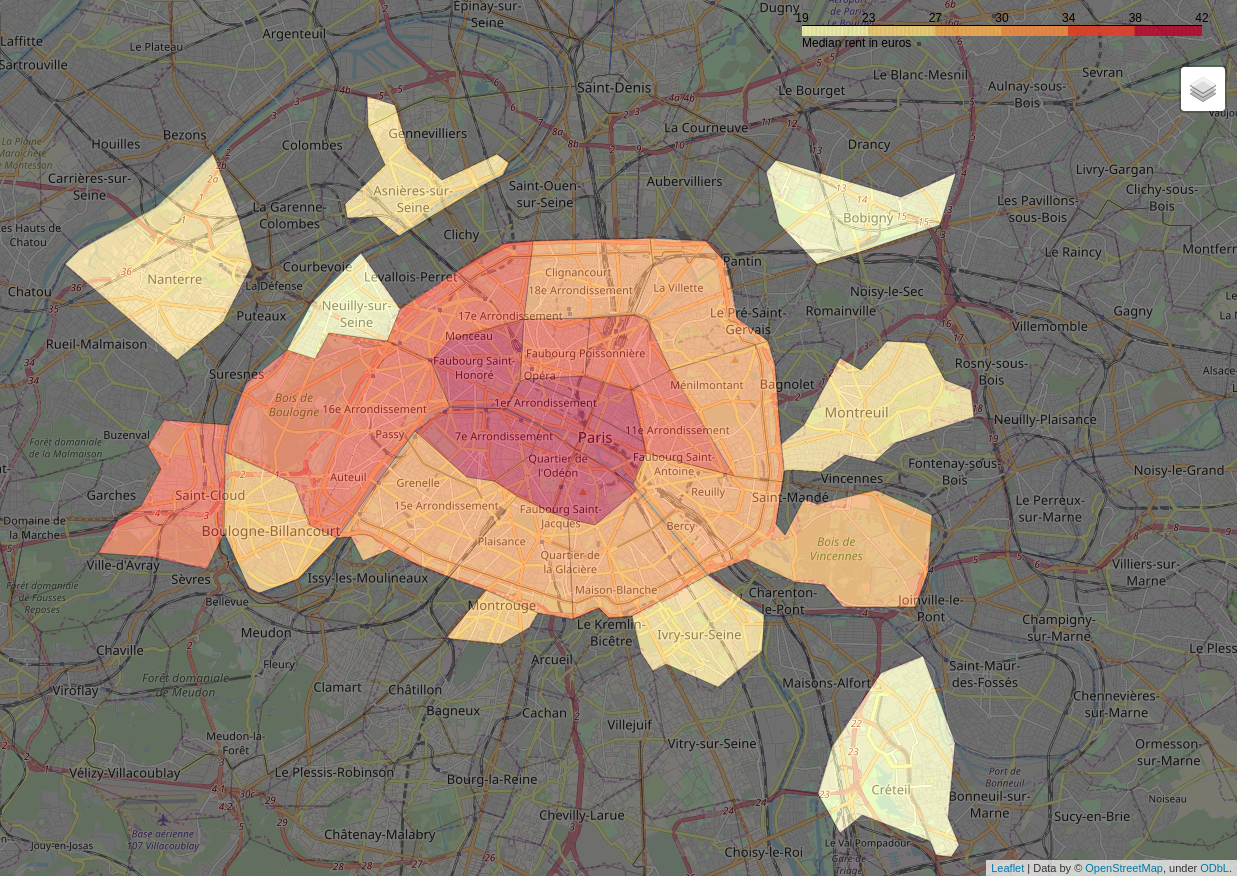
Median rent per m²
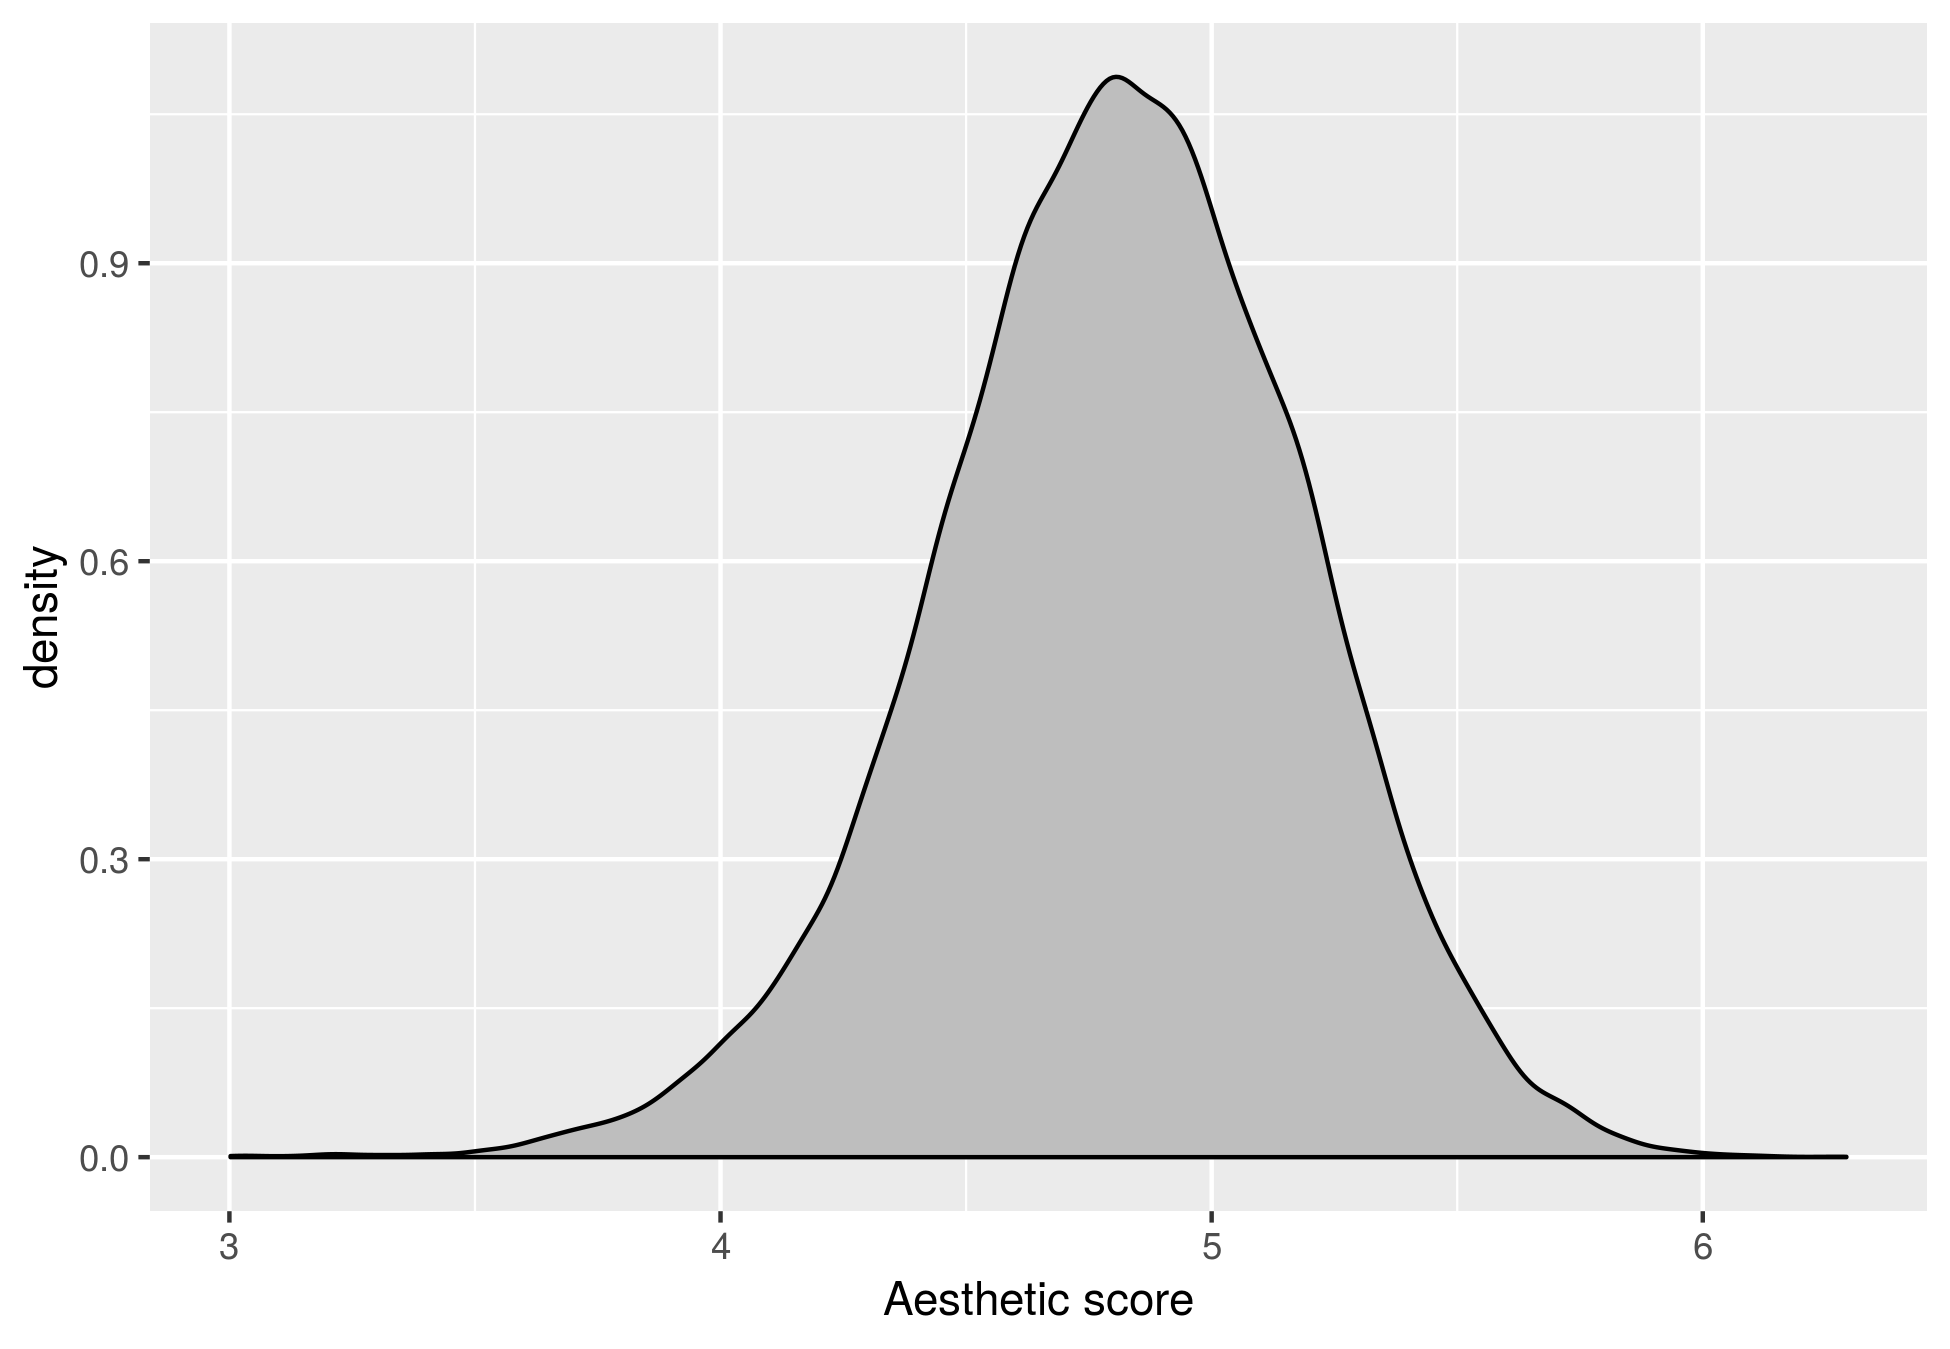
Aesthetic score
- Aesthetic score calculated based on photos
- I use a convolutional neural network (CNN) based on the work of Talebi and Milanfar (2018)
- CNN assigns a score to each photo
- Ad aesthetic score = median score
A primer on CNN, Couchot et al (2016)
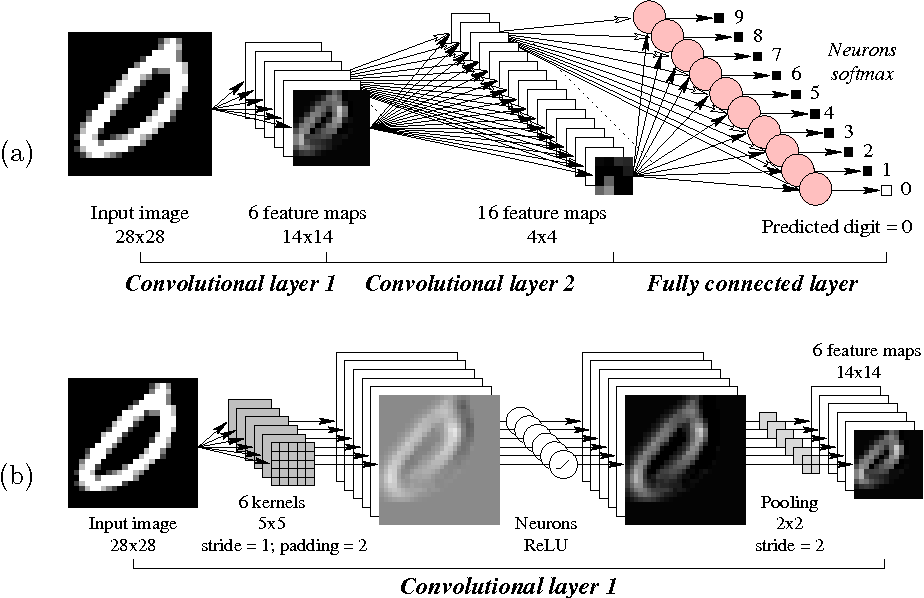
A CNN trained to recognize aesthetic qualities in images, Talebi and Milanfar (2018)
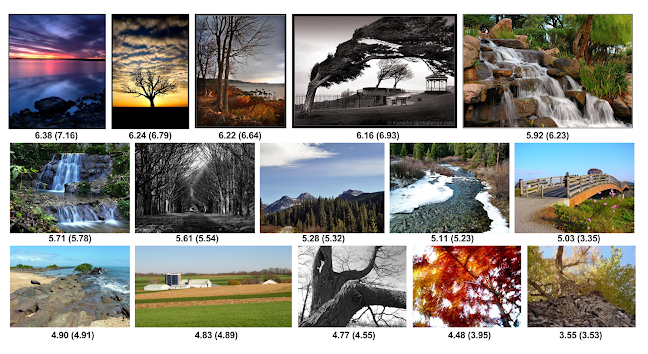
Predicted and human scores (in parenthesis) shown below each image.
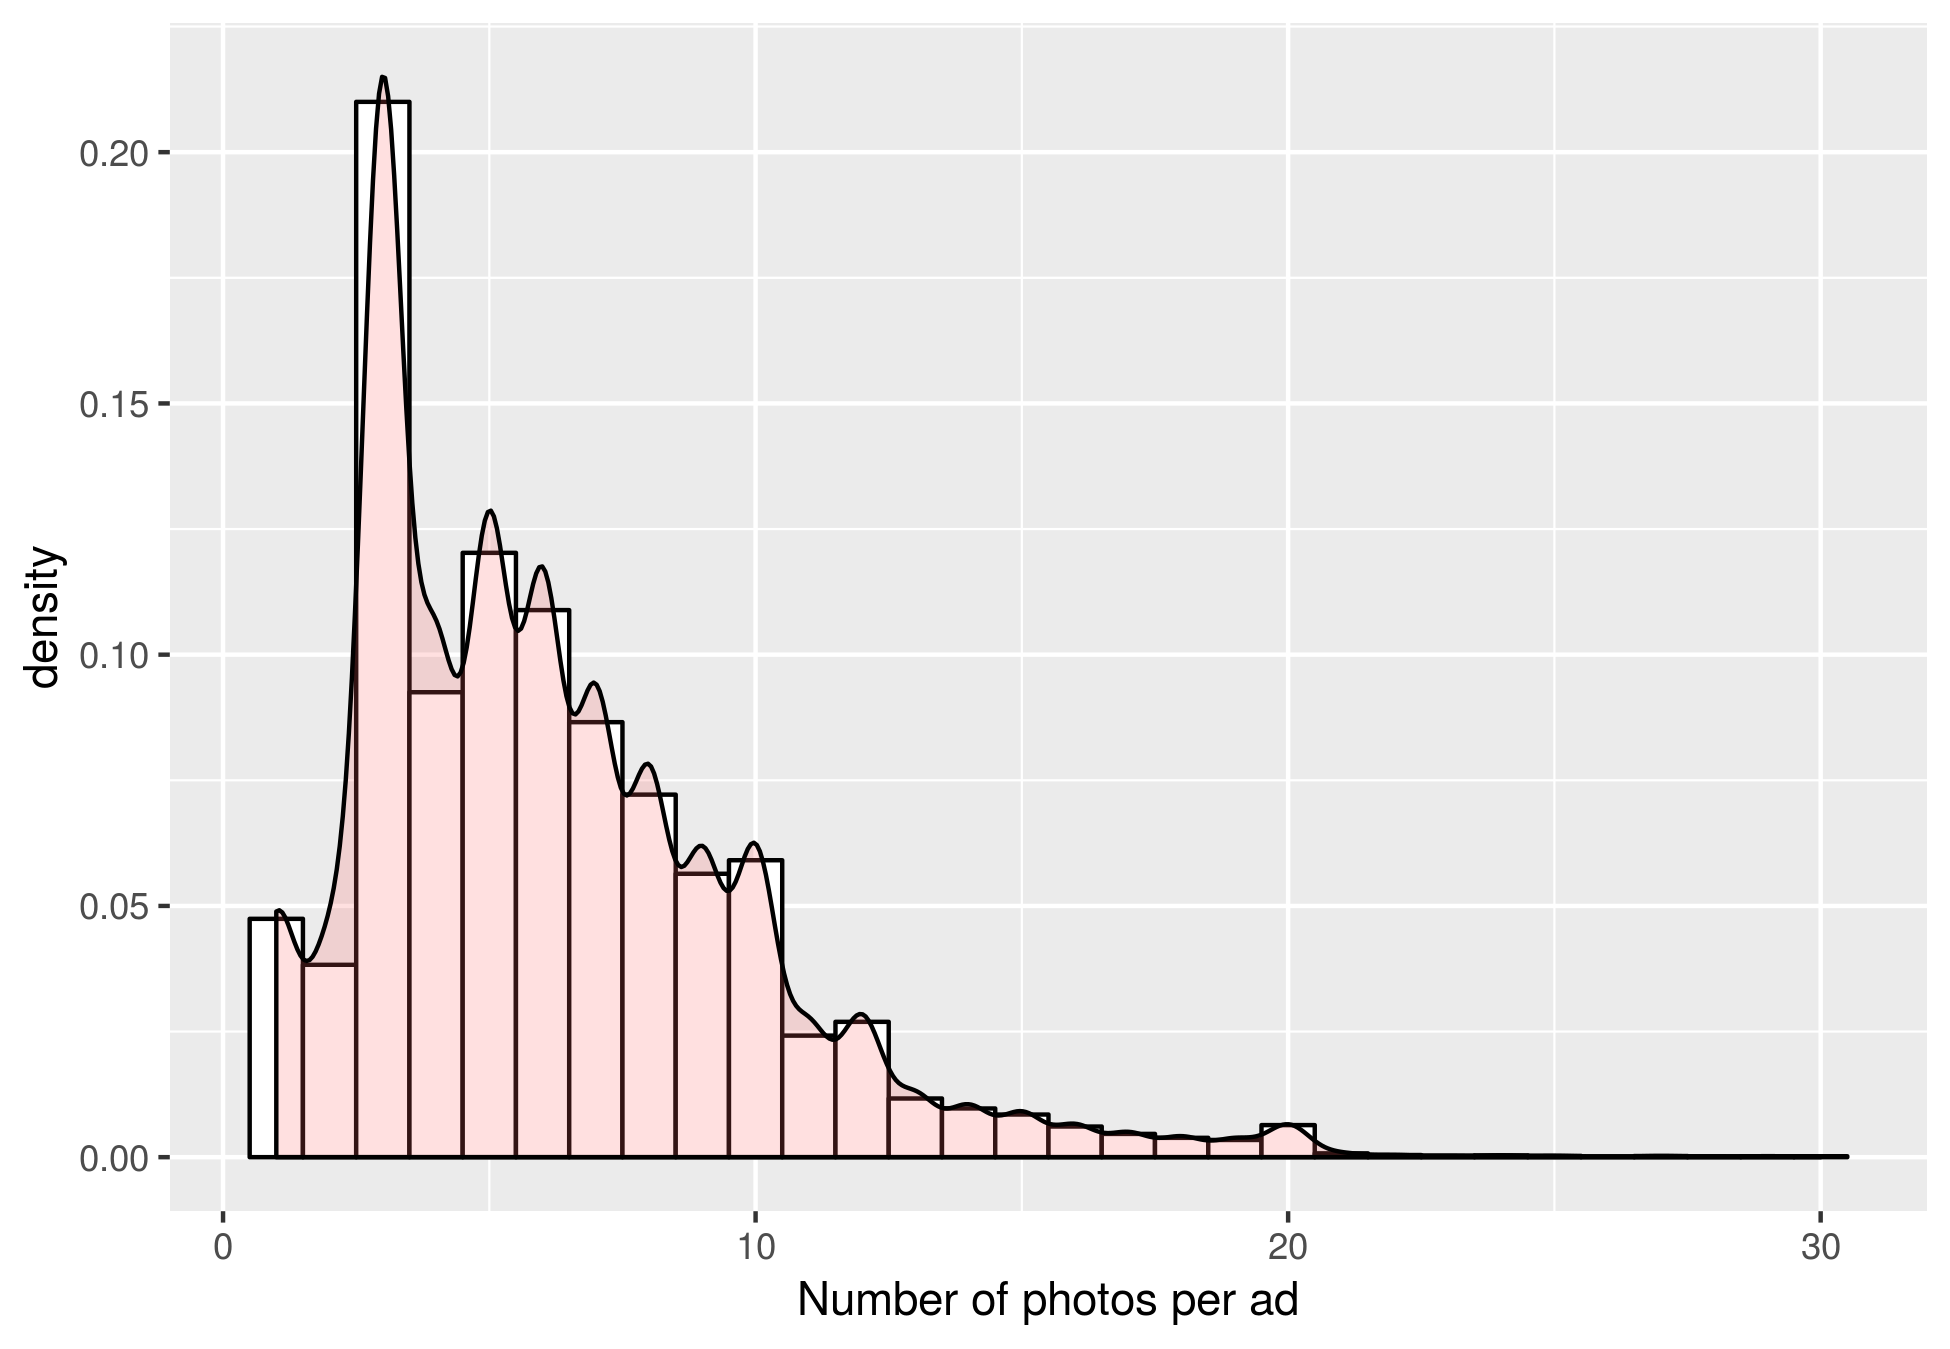
Number of photos per ad
Density aesthetic score
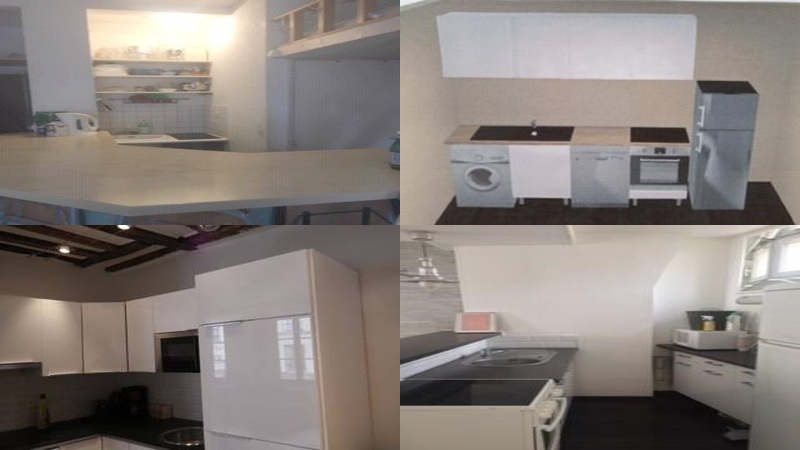
Selected sample of photos in the top 1%

Selected sample of photos in the bottom 1%
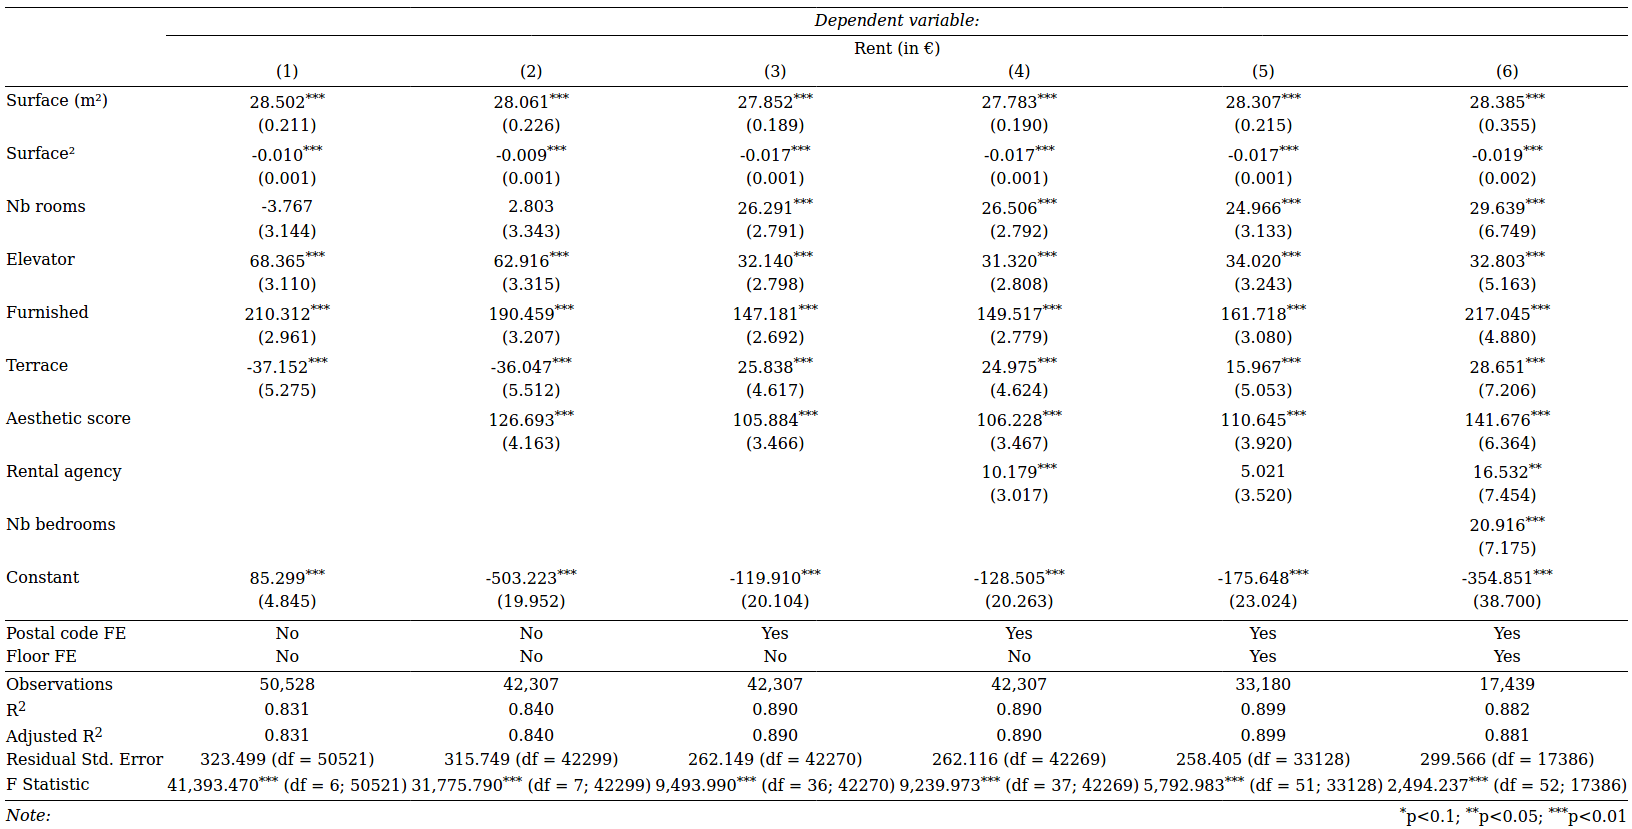
What features are important to predict rent?
Linear model
$$y_{i} = \alpha + \boldsymbol{x_{i}}^{‘} \boldsymbol{\beta} + \varepsilon_{i}$$
- $\boldsymbol{y_{i}}$: rent (in €)
- $\boldsymbol{x_{i}}$: apartment features
- $\alpha$: constant
- $\varepsilon_{i}$: error term
Rent and apartment characteristics
Residual price dispersion and number of contacts
residual price dispersion = predicted price - actual price
- residual price dispersion < 0: More expensive than expected
- residual price dispersion > 0: Cheaper than expected
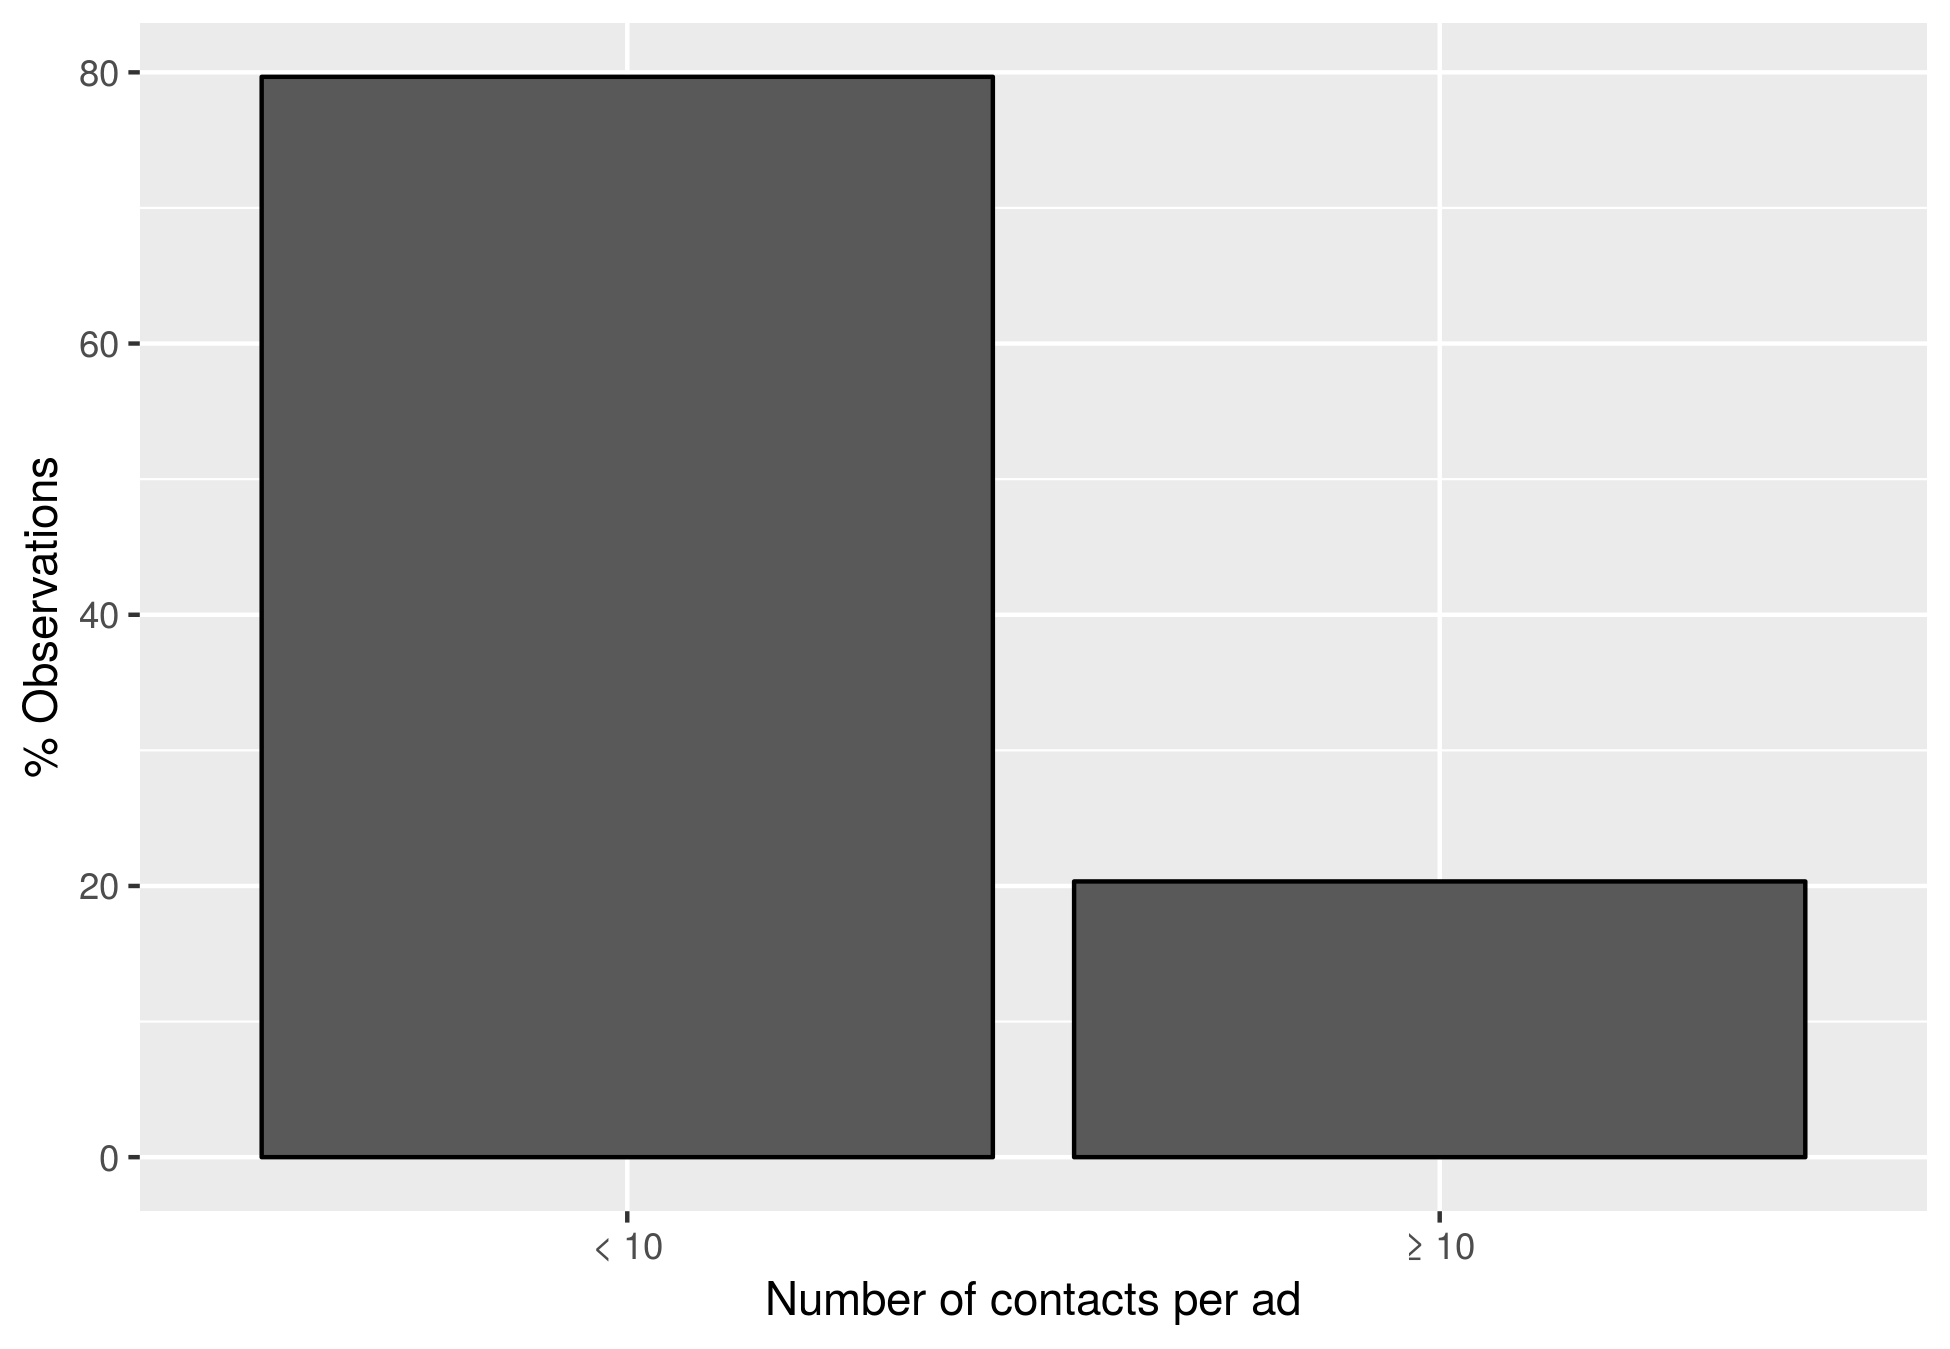
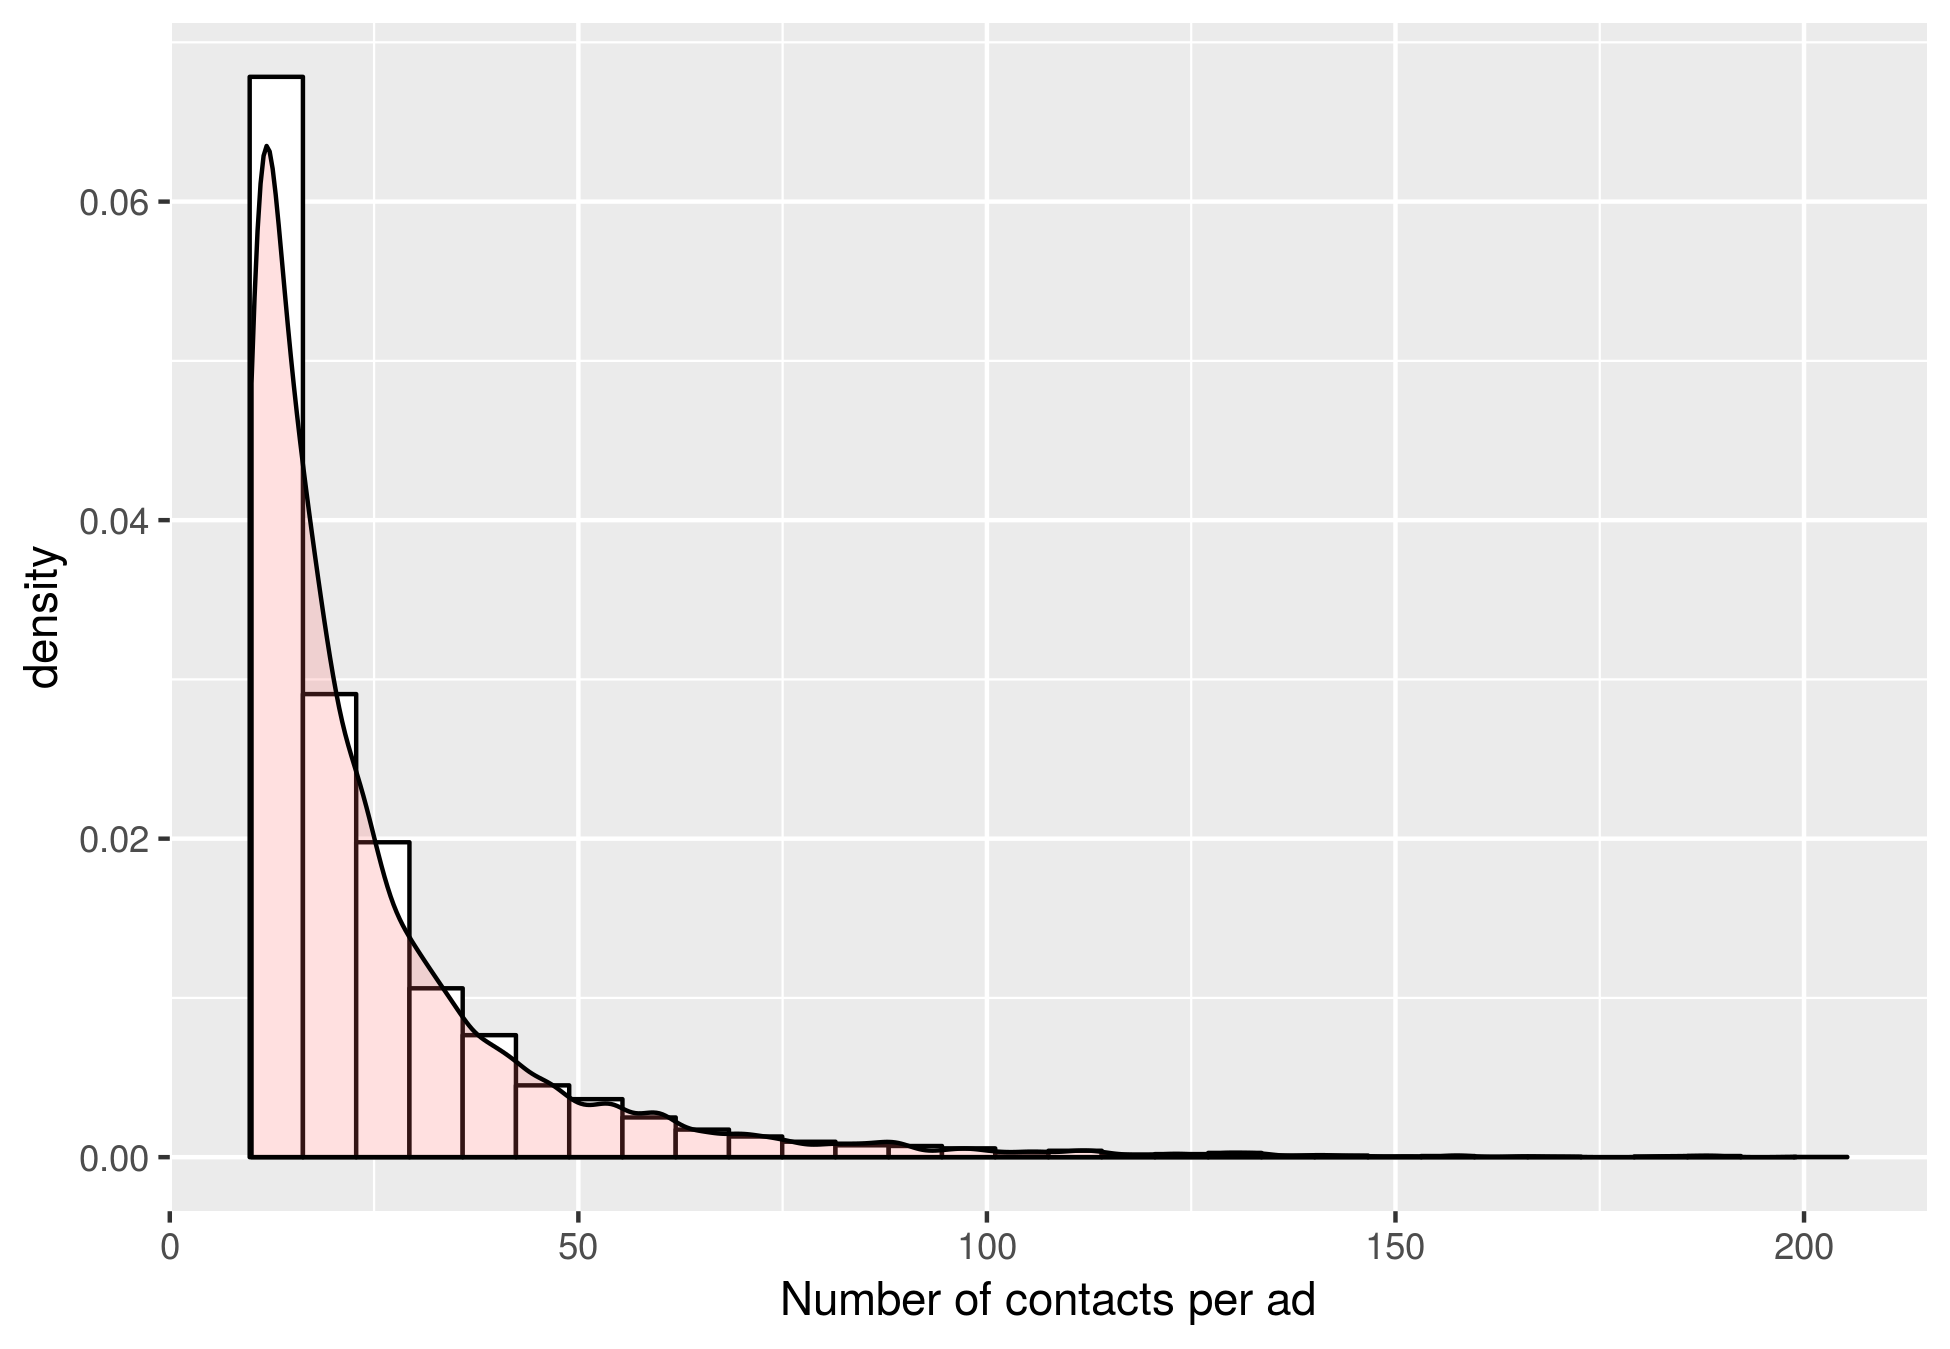
Number of contacts per ad
- I have data on the number of contacts per ad (through the online platform)
- Data is truncated: # of contacts observed only when number of contacts $\geq$ 10
Percentage of ads with more than 10 contacts
Number of contacts per ad
Deviation from predicted price and number of contacts per ad
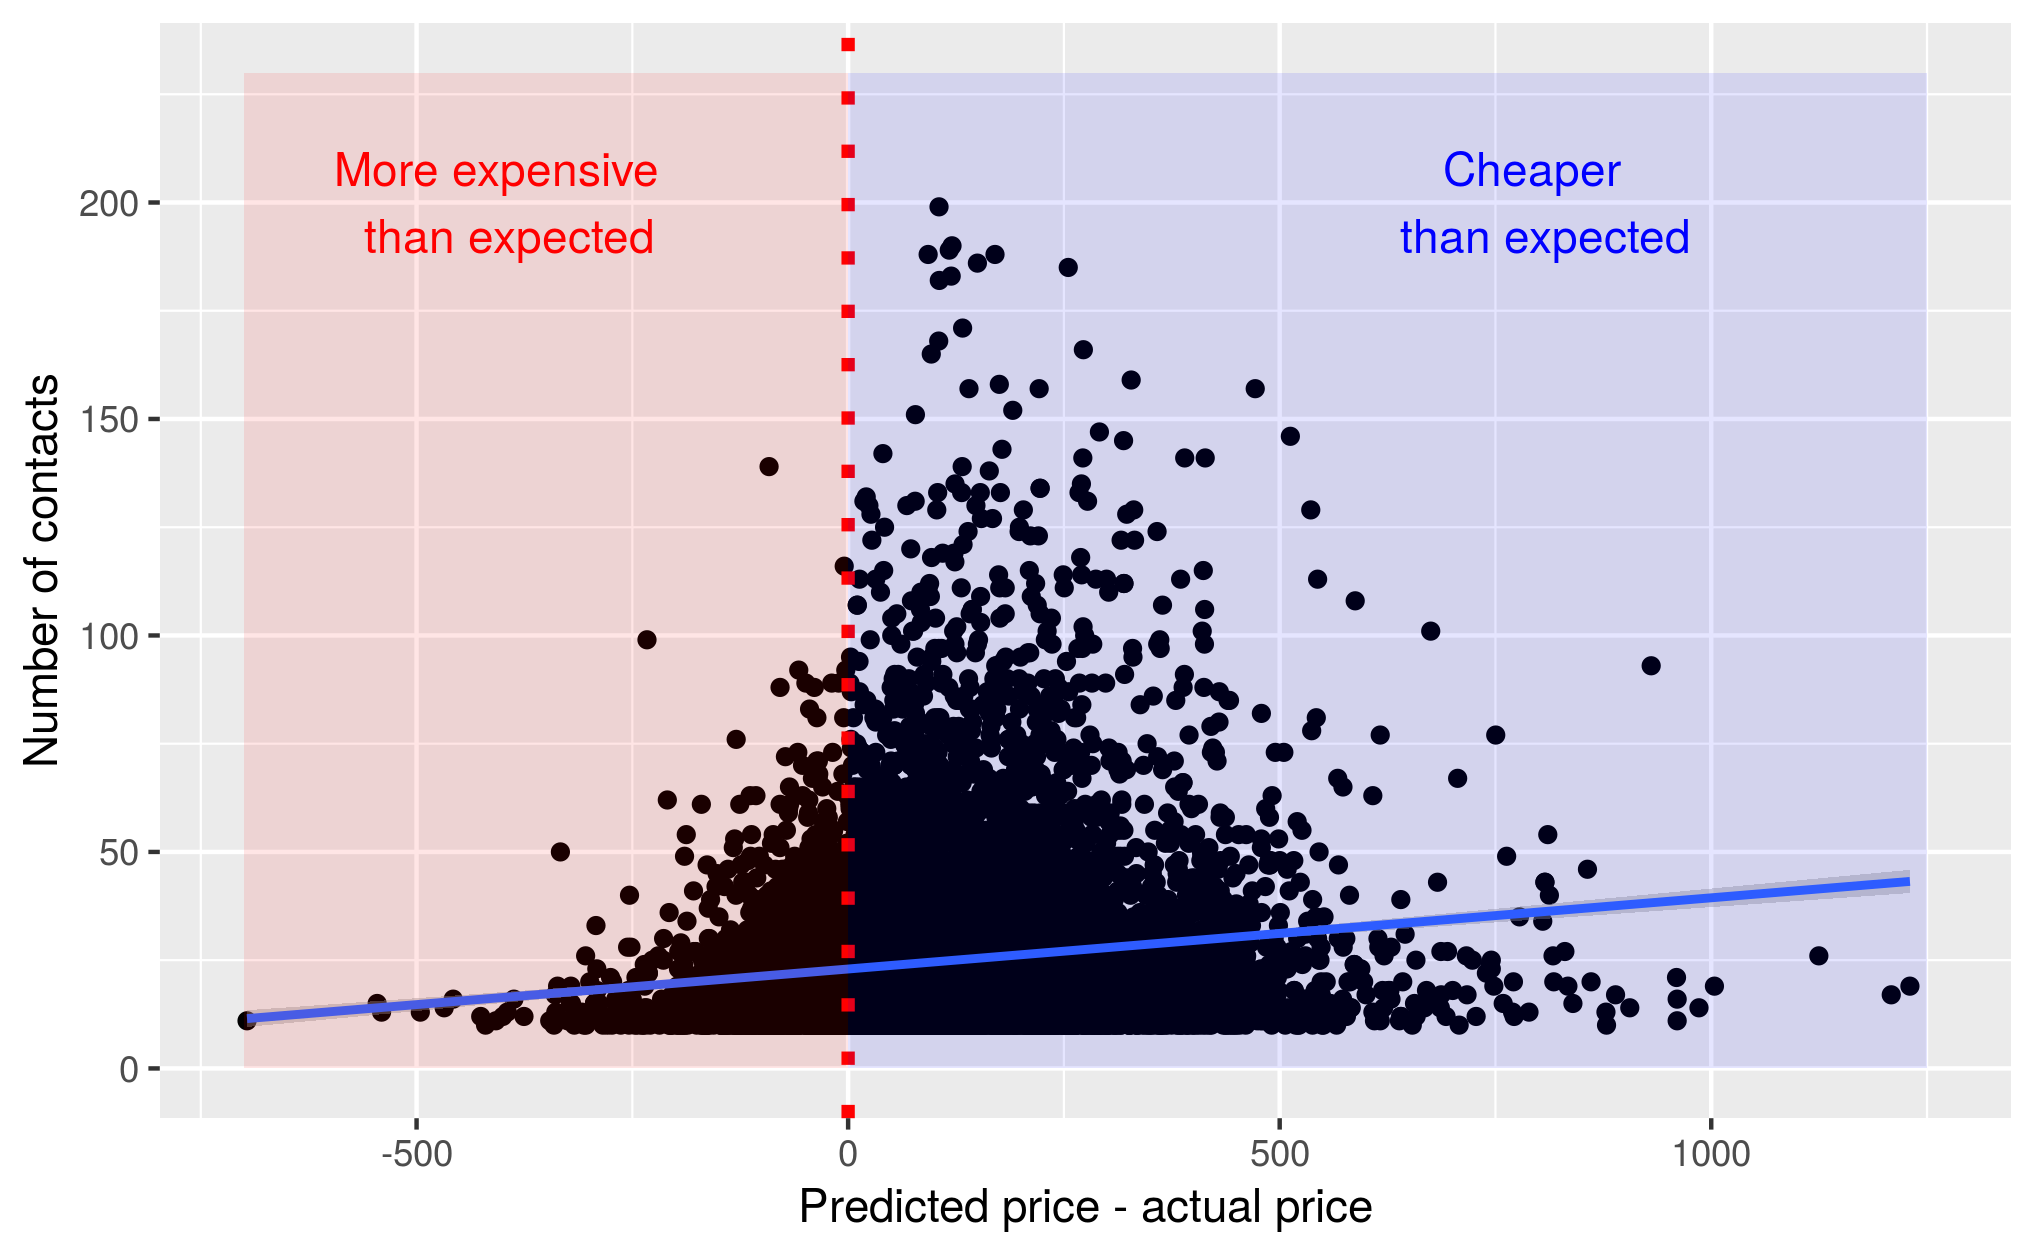
Truncated regression
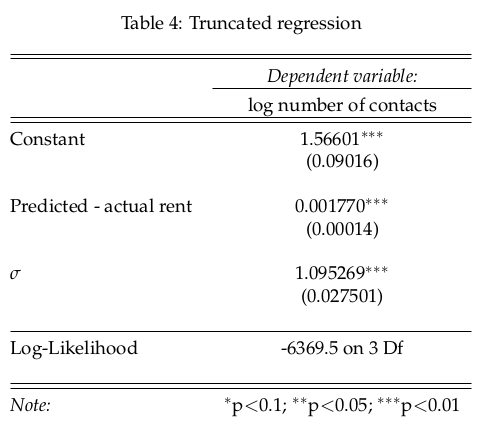
- Interpretation: ↓ monthly rent by 10 euro → number contacts ↑ by approximately 1.8%.
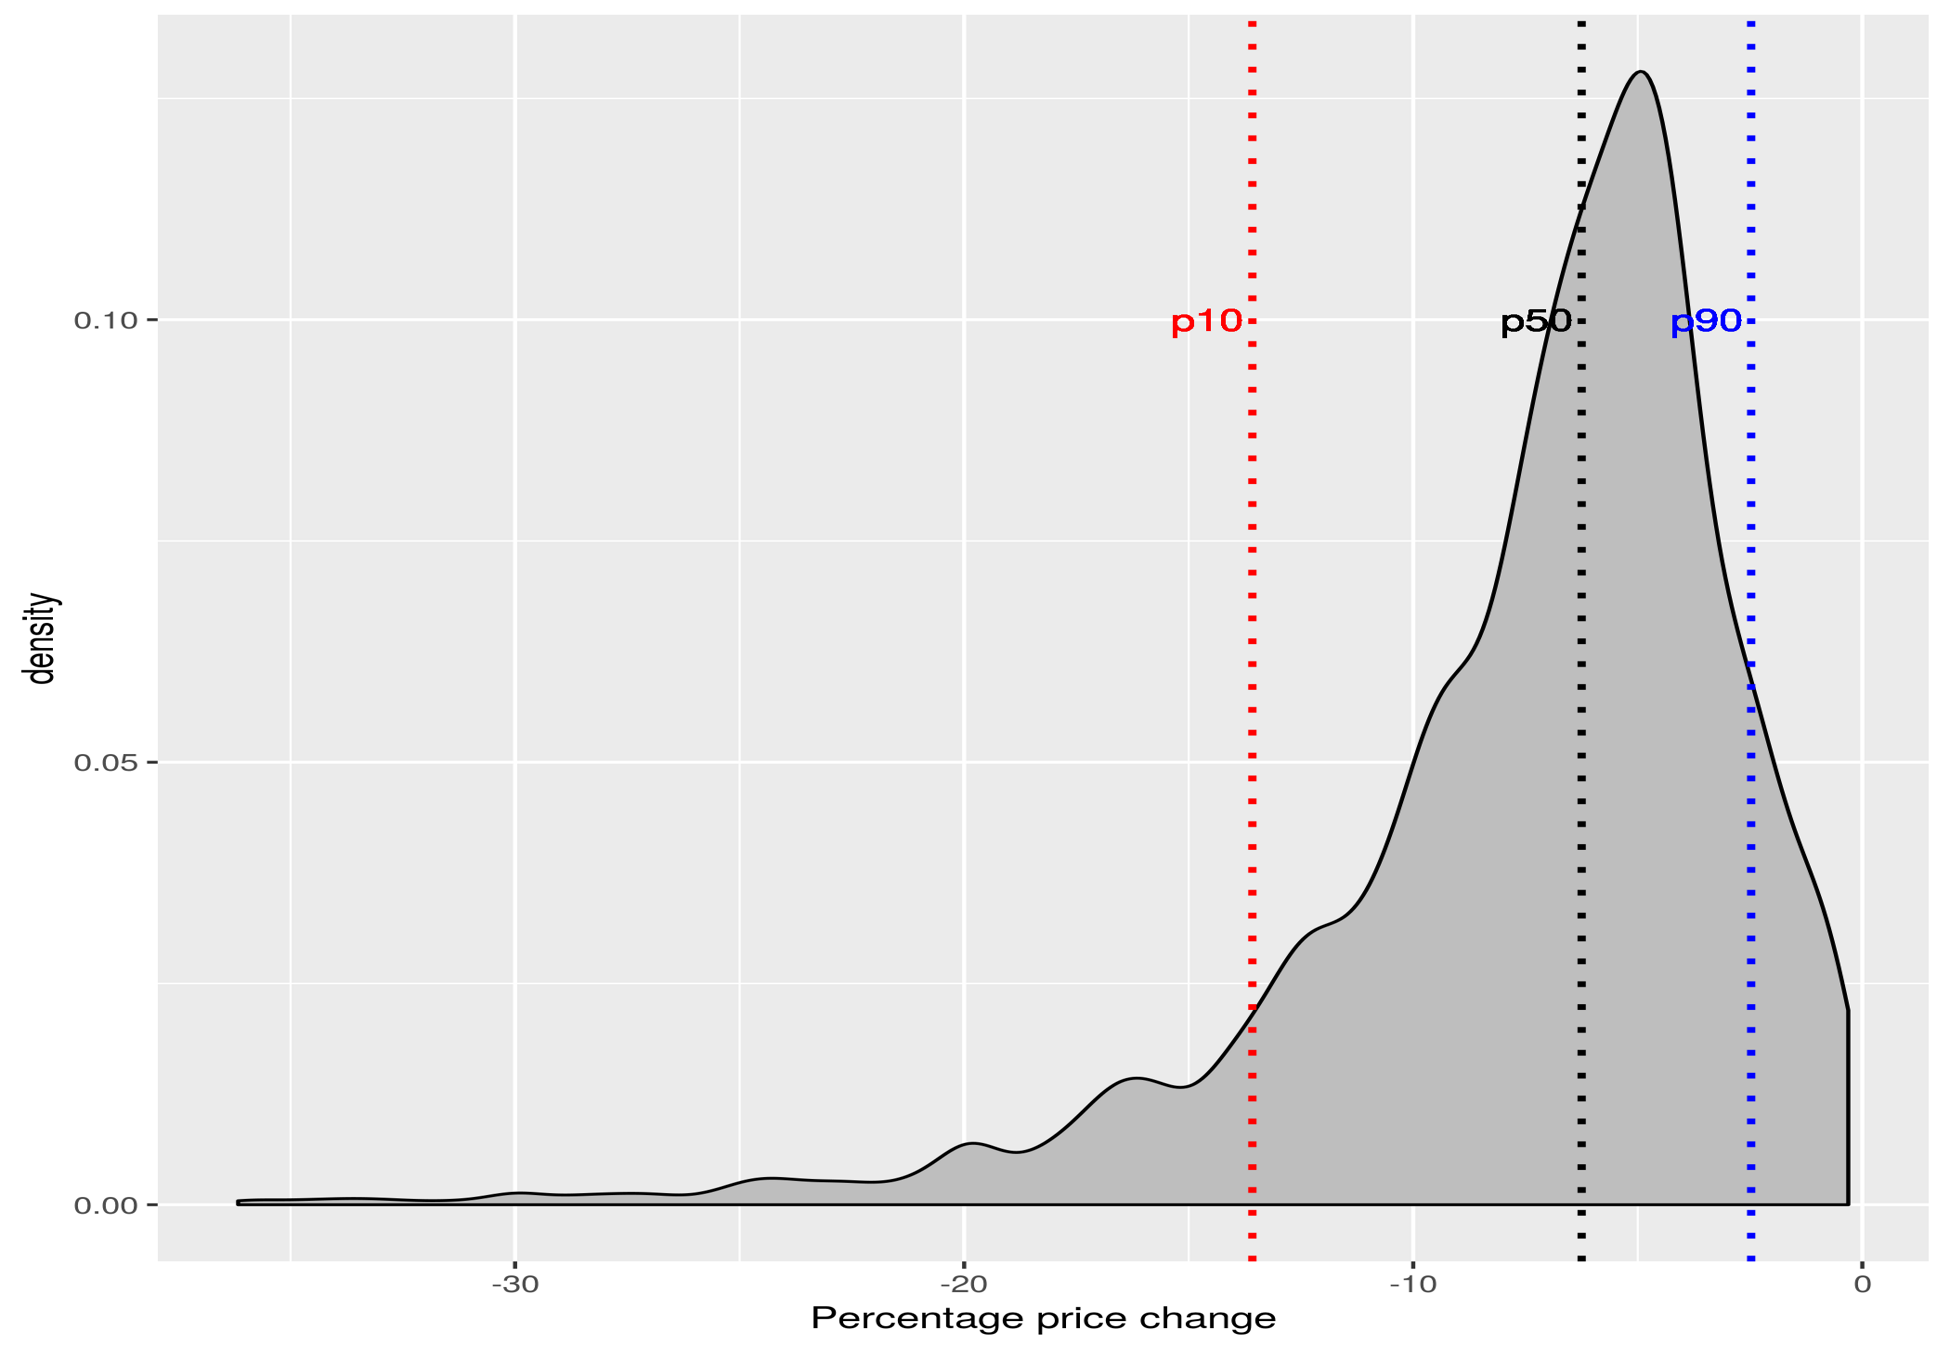
Rent movements
Rent decreases
- Data on rent decreases
- 5% of ads in the sample decreased their advertised rent
- Common strategy for landlords:
- set a price above the market price
- decrease to market price after a “wait and see” period (“slow Dutch auction”)
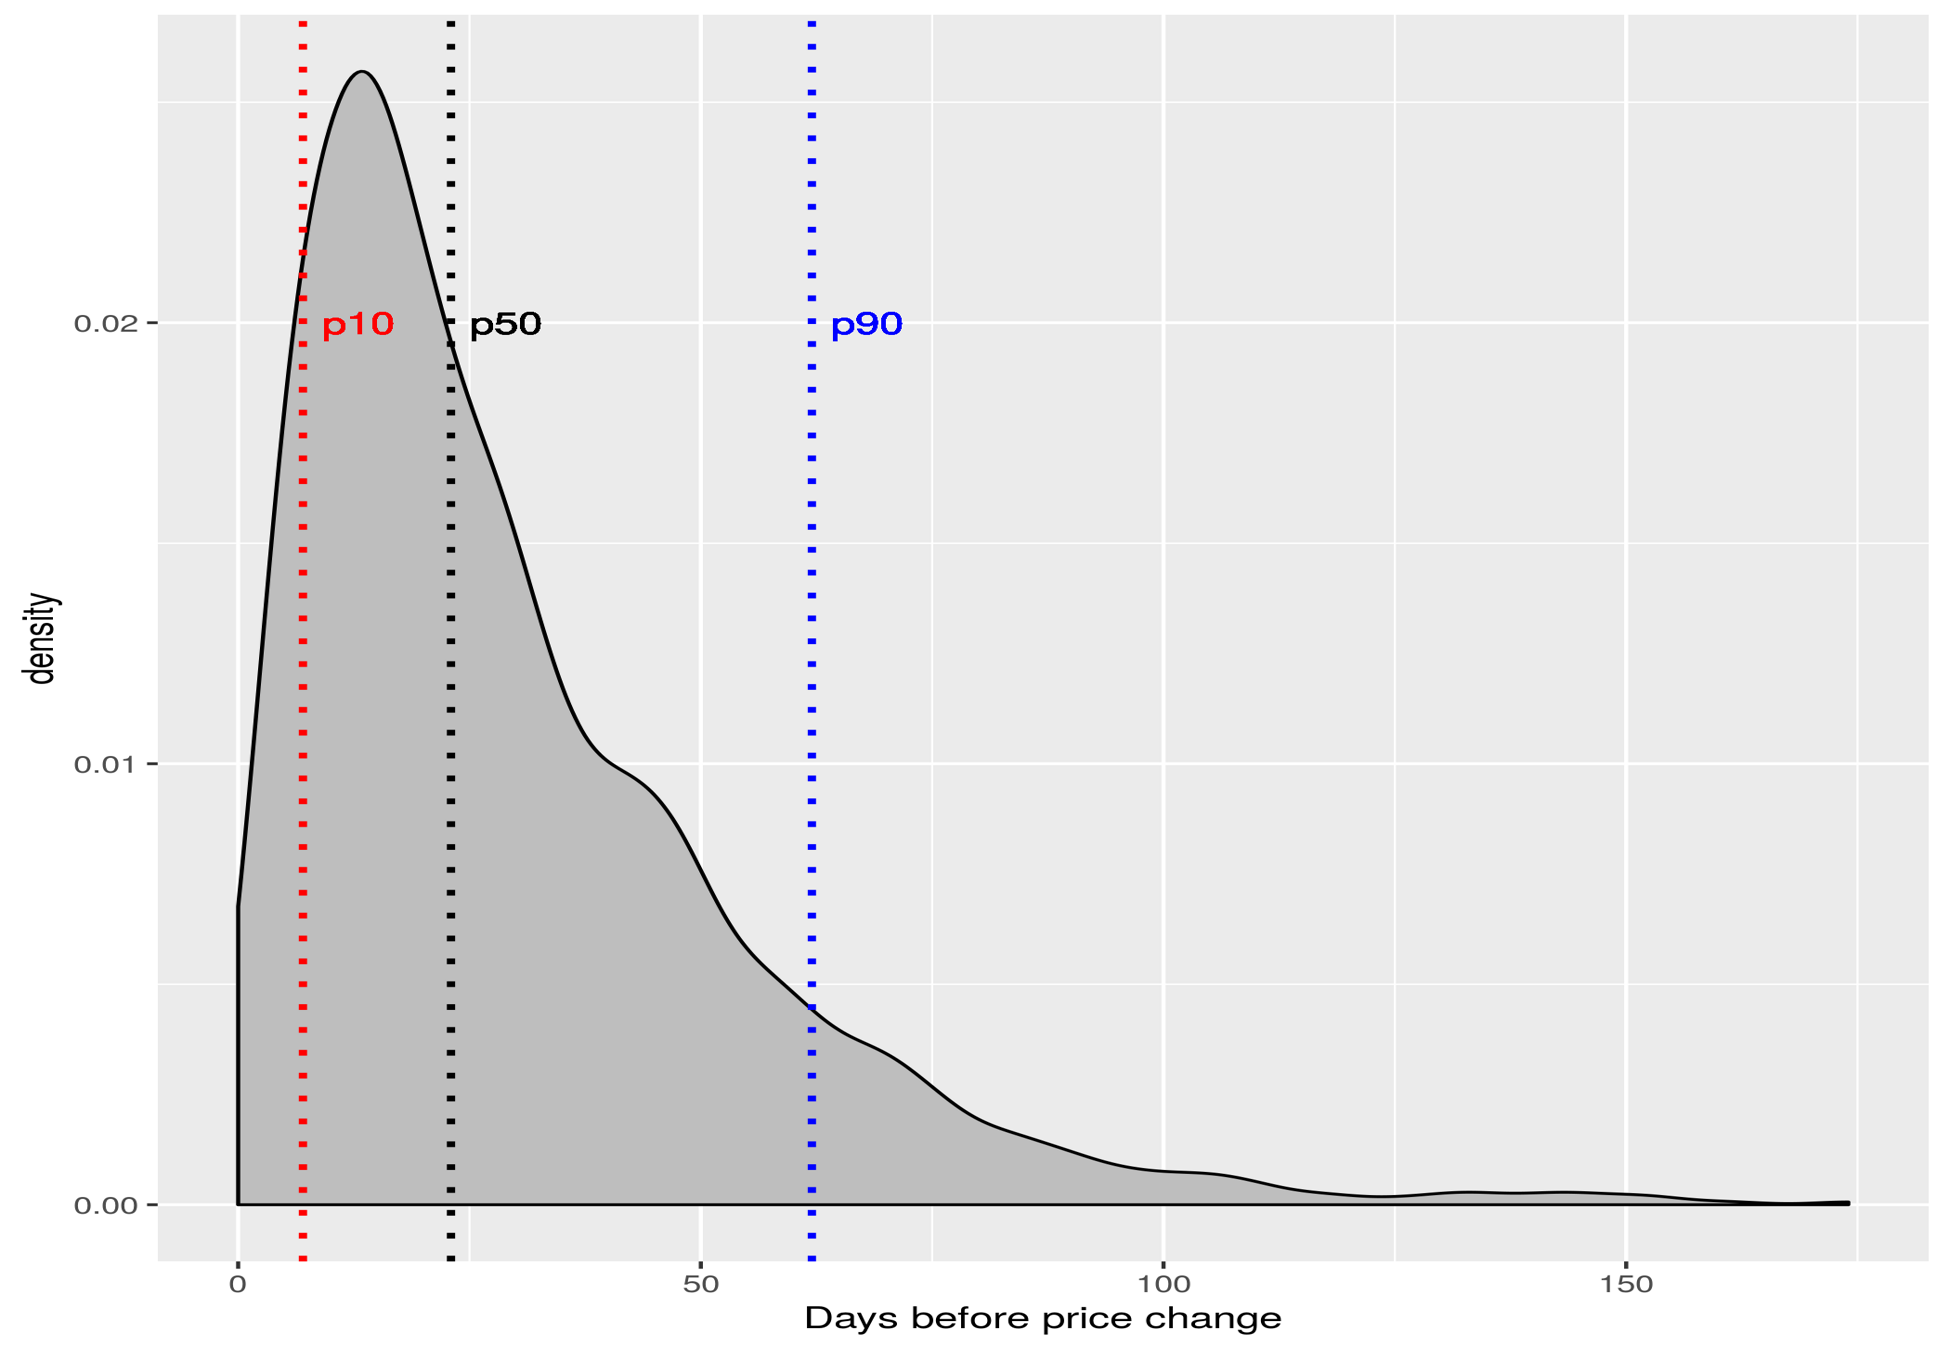
Rent decreases
Days before a rent decrease
T-tests
- discounted listings were:
- more likely to be overpriced
- received less contacts
- more likely to be managed by real estate agencies
Links with literature (1⁄3)
Search-and-matching
- Shimer (1996), Moen (1997), Acemoglu and Shimer (2001), Menzio and Shi (2011), Albrecht, Gautier and Vroman (2016), Schaal (2017)
- Takeaway: directed search -> constrained efficiency
Intertemporal price discrimination
- Stockey (1979), Landsberger and Meilijson (1985) Hendel and Nevo (2013), Garrett (2016)
- Takeaway: IPD -> market power
Links with literature (2⁄3)
Auction
- Empirics: Ashenfelter and Genesove (1992), Lucking-Reiley (1999)
- Theory: Adams, Kluger and Wyatt (1992), Bulow Klemperer (1996), Quan (2002), Carare and Rothkopf (2005), Fuchs and Skrzypacz (2010), Shneyerov (2012), Auster and Kellner (2022)
- Takeaway: a slow Dutch auction may be optimal in a seller’s market and/or with more
impatient buyers
Links with literature (3⁄3)
Optimal Dynamic price setting
- Salant (1991), Merlo, Ortalo-Magné, Rust (2015)
- Takeaway: decreasing sequence of posted price is optimal
Summary
- New evidence of directed search on the rental property market
- “slow Dutch auction” rent setting by some market participants, especially from real estate agencies
- Novel approach to use photos in hedonic pricing models using a interpretable (CNN) results